ポアソン分布 2 群検定と t 検定 U 検定との比較: Q-Q plot も利用
井口豊(生物科学研究所,長野県岡谷市)
最終更新: 2022 年 12 月 1 日
1. はじめに
母平均の検定として, 2 群(2 標本)の場合を考える。このとき,しばしば使われるのが,母集団が正規分布を仮定した t 検定であり,これは一般線形モデルである。それに関しては,別ページで扱った。
では,正規分布に従わない場合は,どうするのか?ここでは,ポアソン分布である場合を考えてみる。
このような場合,ノンパラメトリック検定である Mann-Whitney U 検定を考えることが多い。。しかし, ここでは一般化線形モデルを利用し,ポアソン分布仮定のパラメトリック検定をおこなう。
誤解されやすいが,データや残差が正規分布か否かは,検定のパラメトリック・ノンパラメトリックの選択とは必ずしも関係しない。そのことは,私の共著(倉持・井口,2020)でも注意を促した(文献情報は末尾の参考文献に挙げた)。
したがって,パラメトリック検定,ノンパラメトリック検定は,和訳すれば,母数検定,非母数検定,ということになる。それに関しては,以下のページも参照。
2. データ例
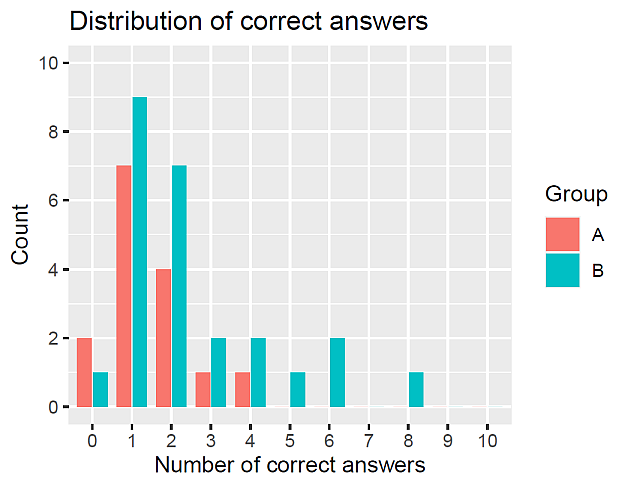
二つのグループ A(n1 = 15), B (n2 = 25)に対する簡単なテスト(正誤問題 10 問)が行われた。以下がその結果である。
#############

# 二群 A, B の点数(各人の正答数)
A<- c(
    1, 1, 0, 1, 3, 2, 1, 1, 1, 2,
    1, 0, 2, 4, 2
)

B<- c(
    1, 2, 1, 2, 1, 2, 1, 4, 1, 1,
    1, 2, 3, 4, 6, 2, 5, 2, 1, 1,
    8, 6, 3, 2, 0
)

# 得点分布

df <- data.frame(
    Count = c(
       table(factor(A, levels = 0:10)),
       table(factor(B, levels = 0:10))
    ),

    N.correct = rep(0:10, 2),

    Group = factor(rep(
       c("A", "B"), each = 11
    ))
)

library(ggplot2)


g<- ggplot(df,
   aes(x = factor(N.correct), y = Count, fill = Group)
    ) +
   geom_col(
     position = position_dodge2(preserve = "single"),
     width = 0.8
   ) +
   labs(
     title = "Distribution of correct answers",
      x = "Number of correct answers",
      y = "Count"
   ) +
   coord_cartesian(ylim = c(0, 10)) +
   scale_y_continuous(breaks=seq(0, 10, 2))

plot(g)

################
結果は,次の図 1 のとおりである。

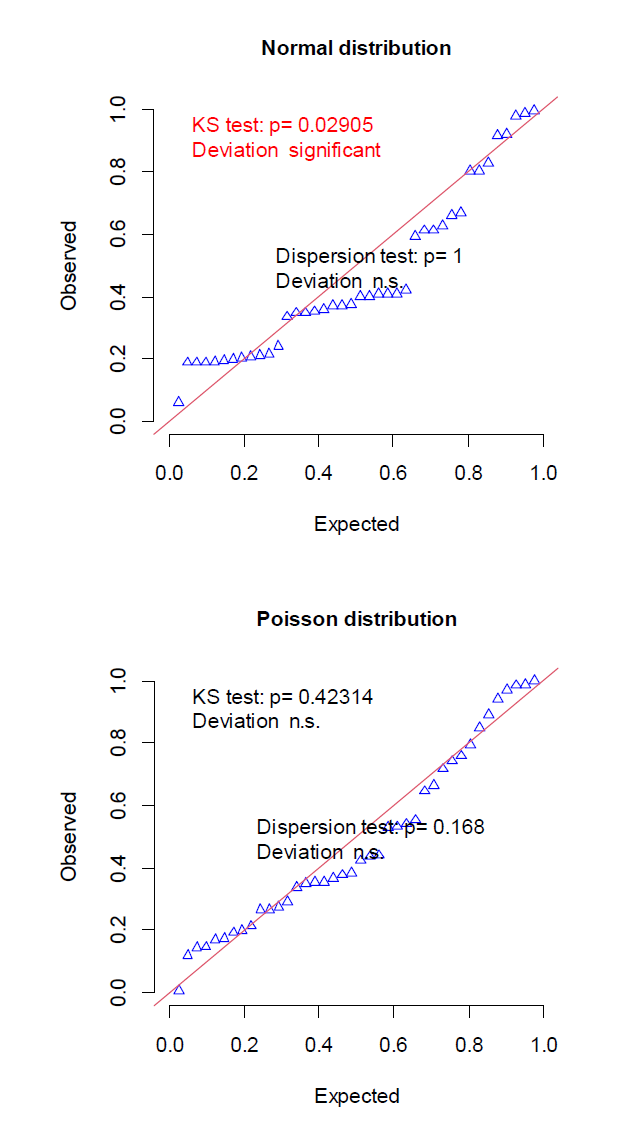
これら二群の平均の差を検定するために,正規分布を仮定し通常の線形モデルを適用した場合と,ポアソン分布を仮定し一般化線形モデルを適用した場合の残差 Q-Q プロットを調べてみる。
#############
# Data

dat<- c(A, B)
grp<- factor(rep(
   c("A", "B"), c(length(A), length(B))
))

# Regression
# Normal
mod.norm<- lm(dat ~ grp)

# Poisson
mod.pois<- glm(
    dat ~ grp,
    family = poisson(link  ="identity")
)

# Q-Q plots of residuals
library(DHARMa)

# Normal
plotQQunif(
 mod.norm,
 testOutliers=F,
 cex = 0.8, col = "blue",
 main = "Normal distribution"
)

# Poisson
plotQQunif(
 mod.pois,
 testOutliers=F,
 cex = 0.8, col = "blue",
 main = "Poisson distribution"
)

################
結果は,次の図 2 のとおりである。

正規分布を仮定した線形モデル(t 検定)よりも,ポアソン分布を仮定した一般化線形モデルのほうが適合が良いようだ。
では,実際に,これらの検定に, Mann-Whitney U 検定を加えた 3 種類の検定結果を比較してみる。
#############
# 一般化線形モデル(ポアソン分布)
mod.pois<- glm(
    dat ~ grp,
    family = poisson(link  ="identity")
)
summary(mod.pois)

# 線形モデル(正規分布) t 検定
mod.norm<- lm(dat ~ grp)
summary(mod.norm)

# Mann-Whitney U 検定
library(exactRankTests)
wilcox.exact(dat ~ grp)

################
結果は,以下のとおりである.主要部分を抜粋した。
#############
# 一般化線形モデル(ポアソン分布)
Coefficients:
            Estimate Std. Error z value Pr(>|z|)
(Intercept)   1.4667     0.3127   4.690 2.73e-06 ***
grpB          1.0133     0.4438   2.283   0.0224 *

# 線形モデル(正規分布) t 検定
Coefficients:
            Estimate Std. Error t value Pr(>|t|)
(Intercept)   1.4667     0.4392   3.339  0.00189 **
grpB          1.0133     0.5556   1.824  0.07605 .

# Mann-Whitney U 検定
W = 131.5, p-value = 0.1052

################
これら 3 種類の検定の中で, 5 % 水準で 2 群の平均に有意差が認められたのは,一般化線形モデル(ポアソン分布)だけだった。正規分布に従わなければ,何でもかんでもノンパラメトリック検定,特に U 検定に飛びつくのは考えものである。
関連ページ
参考文献
倉持龍彦・井口豊 (2020) “R言語”が導く統計解析の世界. 血液浄化とそれを支える基盤技術,織田成人・酒井清孝(編),東京医学社:167-182.